Disclosure: This page contains commercial links. BizBot may earn a commission from qualifying purchases. Paid placements do not buy a better ranking. Read our affiliate disclosure.
Mobile subscription analytics tools are essential for tracking app revenue, understanding user behavior, and reducing churn. This article reviews seven tools that help businesses optimize subscriptions and grow revenue. All prices below were checked against each vendor’s own pricing page in August 2026; confirm them before you budget, because this category re-prices often.
- RevenueCat: Simplifies in-app subscription management with a single API, no-code paywall editor, and detailed analytics. Free for apps under $2,500 Monthly Tracked Revenue (MTR).
- ChartMogul: Offers subscription metrics like MRR, churn, and LTV with App Store Connect integration. Free under $10,000 MRR; paid plans from $59/month.
- Amplitude: Focuses on behavioral analytics with tools like Revenue LTV Charts and Funnel Analysis. Free for up to 2 million events per month.
- Mixpanel: Tracks subscription events and connects product usage to financial outcomes. Free for up to 1 million monthly events.
- Firebase Analytics: Free tool from Google for tracking in-app purchases and subscriptions with BigQuery integration for advanced analysis.
- AppsFlyer: Links marketing spend to subscription revenue and offers deep attribution analytics. Free Zero plan; paid conversions at $0.07 each.
- UXCam: Focuses on user experience with session replays, heatmaps, and funnel analytics. Pricing is quote-only, based on monthly session volume.
These tools cater to different business needs – whether you’re managing subscriptions, analyzing user behavior, or tracking marketing performance. Choose based on your app’s size, goals, and budget.
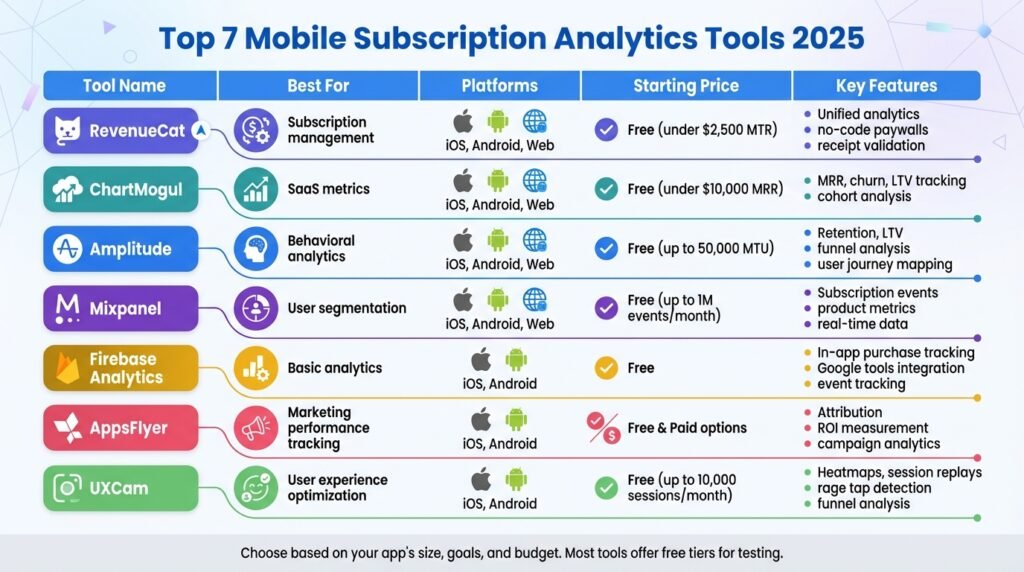
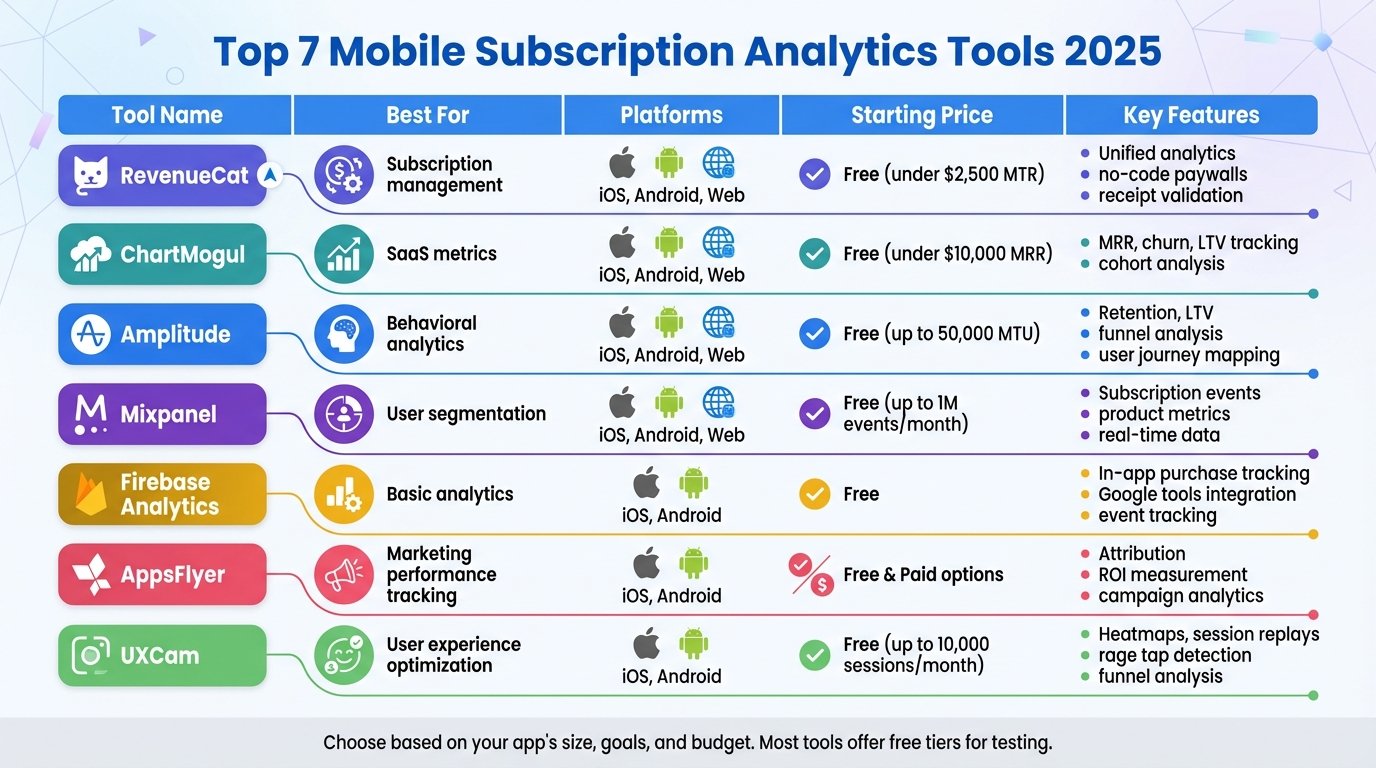
Quick Comparison
| Tool Name | Best For | Platforms | Starting Price | Key Features |
|---|---|---|---|---|
| RevenueCat | Subscription management | iOS, Android, Web | Free under $2,500 MTR, then 1% of MTR | Unified analytics, no-code paywalls |
| ChartMogul | SaaS metrics | iOS, Android, Web | Free under $10K MRR; paid from $59/mo | MRR, churn, LTV tracking |
| Amplitude | Behavioral analytics | iOS, Android, Web | Free to 2M events/mo | Retention, LTV, funnel analysis |
| Mixpanel | User segmentation | iOS, Android, Web | Free to 1M events/mo | Subscription events, product metrics |
| Firebase | Basic analytics | iOS, Android | Free | In-app purchase tracking, Google tools |
| AppsFlyer | Marketing performance tracking | iOS, Android | Free Zero plan; $0.07/conversion | Attribution, ROI measurement |
| UXCam | User experience optimization | iOS, Android | Not published – quote only | Heatmaps, session replays, rage tap data |
Pick the tool that aligns with your app’s needs and try free tiers or trials to determine the best fit.
Mobile Subscription Analytics Tools Comparison 2025: Features, Pricing & Platforms
1. RevenueCat
Mobile Subscription Management Features
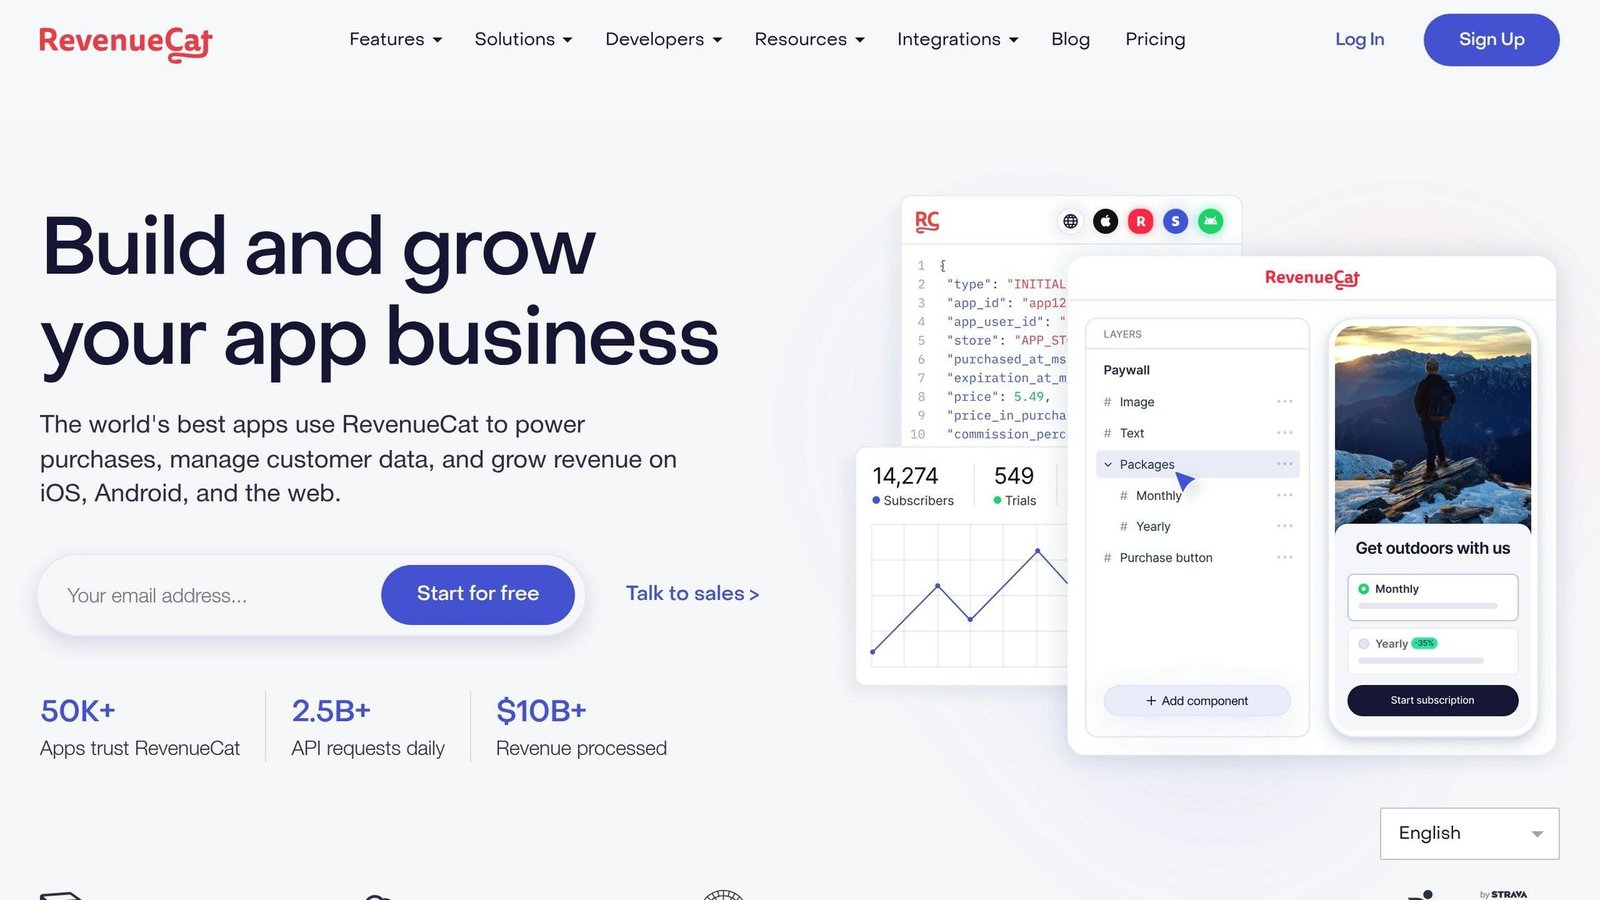
RevenueCat is a backend for mobile subscription billing behind a single API. Its homepage reports more than 130,000 apps supported, over 2 billion API requests a day, and more than $16 billion in revenue processed. With tools like a no-code paywall editor and a flexible entitlements system, RevenueCat allows you to tweak pricing models and manage user access without requiring app store updates.
The platform also offers growth-focused tools, including A/B testing for pricing experiments and audience segmentation based on factors like country, product, or in-app placement. On the customer support side, there is automated refund handling. You can also manage promotions from a centralized dashboard.
A note on the customer results this article used to quote: several precise figures attributed to named apps could not be traced to a published source, so they have been removed rather than repeated. Where a vendor case study does back a number, it is cited as such below.
With these management tools covered, let’s look at RevenueCat’s pricing structure.
Pricing and Affordability
RevenueCat offers a free tier for apps generating up to $2,500 in Monthly Tracked Revenue (MTR). Above that, the Pro plan is billed at 1% of tracked revenue. RevenueCat states the rate as “1% of what you track” without publishing a worked example, so model your own bill against your MTR rather than trusting a rule of thumb. A separate Growth Tools option charges 1% of MTR only on the conversions you run through RevenueCat’s paywalls and web-to-app funnels, which suits teams that already own their in-app purchase infrastructure.
For larger-scale apps, the Enterprise plan provides custom pricing and usage terms, along with volume discounts, dedicated support and custom SLAs.
Now, let’s look at how the platform performs across various devices and operating systems.
Platform Compatibility (iOS/Android)
RevenueCat supports a range of platforms, including iOS, Android, Web, Smart TV, the Amazon Appstore, and Stripe, using open-source SDKs. The platform takes care of receipt validation and handles platform-specific edge cases automatically, which saves you from maintaining separate codebases for different app stores. When Apple or Google change their billing systems, that maintenance sits with RevenueCat rather than with you.
RevenueCat publishes named customer stories including OpenAI’s ChatGPT, ElevenLabs, Ladder, Opal, Runna and VSCO. Treat the headline numbers in them as vendor marketing: they are selected examples, not a representative sample of what an average app achieves.
Analytics Capabilities for Subscription Metrics
In addition to its management and pricing features, RevenueCat covers subscription analytics. The platform provides built-in reporting for key metrics such as monthly recurring revenue (MRR), churn, lifetime value (LTV), and trial conversion rates. Its real-time dashboards offer cohort analysis and revenue trends, and no-code integrations connect it to tools like Braze and AppsFlyer.
One customer result RevenueCat does publish with a named source: VSCO reported a membership churn reduction of almost 5% after using winback messaging, quoted to Shaheen Essabhoy in business intelligence there. That is the kind of claim worth asking any vendor for – named, specific, and attributable.
2. ChartMogul
Analytics Capabilities for Subscription Metrics
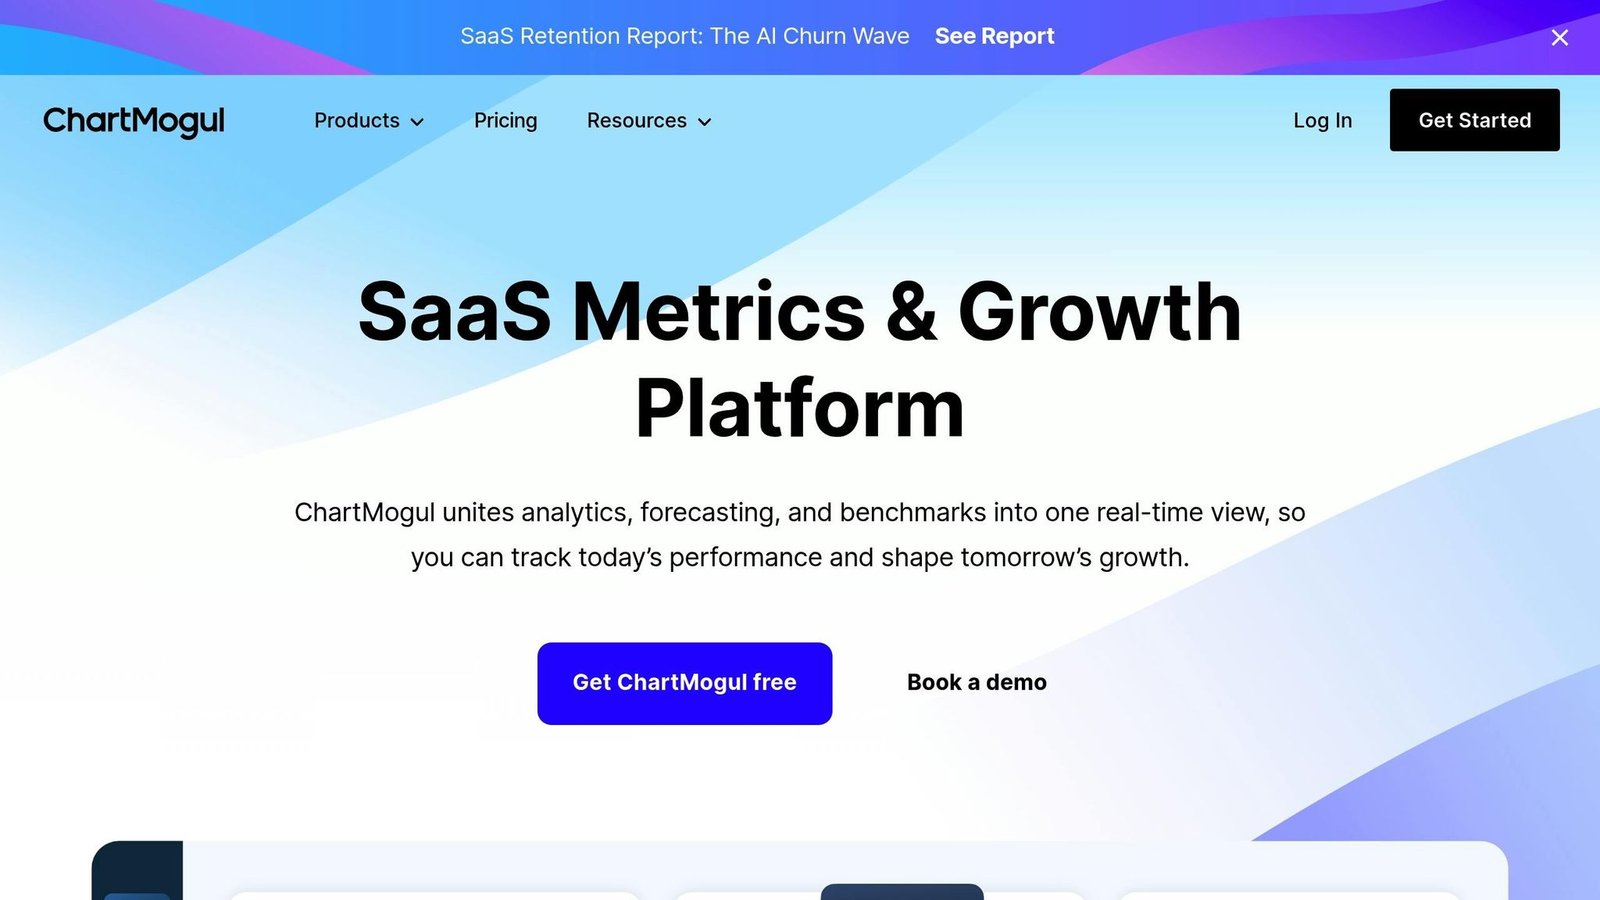
ChartMogul turns raw subscription data into clear, actionable insights. It tracks essential metrics like MRR (Monthly Recurring Revenue), ARR (Annual Recurring Revenue), LTV (Lifetime Value), churn, retention, and ARPA (Average Revenue Per Account) through an intuitive interface, and it offers benchmarking against other SaaS companies on the platform.
One standout feature is its integration with App Store Connect, which automatically imports sales and refund data to generate analytics and cash flow metrics. This data refreshes every 24 hours, keeping your reports up-to-date.
However, it’s worth noting that the platform doesn’t offer real-time notifications via Slack or email for mobile app changes. Its analytics still provide a strong foundation for managing mobile subscription data.
Mobile Subscription Management Features
ChartMogul addresses common challenges in mobile subscription data by merging duplicate records and linking subscriptions across billing changes. This is especially important since App Store Connect only provides subscriber IDs. With these tools, you can conduct detailed analyses of recurring revenue trends.
The platform’s CRM integrates billing events with customer interactions, offering a more comprehensive view of your subscribers. Additionally, its API and webhooks allow for custom, real-time integrations tailored to specific business needs.
Pricing and Affordability
ChartMogul’s pricing scales with your ARR. For startups, the Free plan supports businesses with less than $10,000 in MRR (roughly $120,000 ARR) and includes unlimited users along with access to core SaaS metrics.
Above that threshold there are two published tiers, both of which cover businesses up to $10 million ARR and both of which slide with your revenue:
- Starter: $59 to $515 per month depending on your ARR tier, with up to 3 team members and one billing source
- Pro: $99 to $1,199 per month depending on your ARR tier, with unlimited team members, up to five billing systems, two-way CRM sync and data warehouse push
- Enterprise: $19,900 per year for businesses above $10 million ARR
Annual billing saves 17% against monthly. Note that the entry price is the floor of a range, not a flat rate – the figure you actually pay depends on which ARR band you land in, so check the vendor’s calculator rather than budgeting from the starting number.
Platform Compatibility (iOS/Android)
ChartMogul supports both iOS and Android through its native mobile apps, so you can monitor metrics away from a desk. For iOS apps, the App Store Connect integration uses a “Reporter” access token to download daily subscriber reports for auto-renewable subscriptions. The initial setup imports up to 12 months of historical data.
Keep in mind, access tokens expire every 180 days, so you’ll need to set reminders to regenerate them to maintain uninterrupted data syncing. To improve revenue reporting accuracy, you can enable the “Use Developer Proceeds instead of Customer Price” option, which excludes taxes and store fees from MRR calculations.
ChartMogul also integrates with platforms like Stripe, Google Play, Chargebee, Recurly, and WooCommerce. For advanced analytics, it connects with data warehouses such as Snowflake and BigQuery.
3. Amplitude
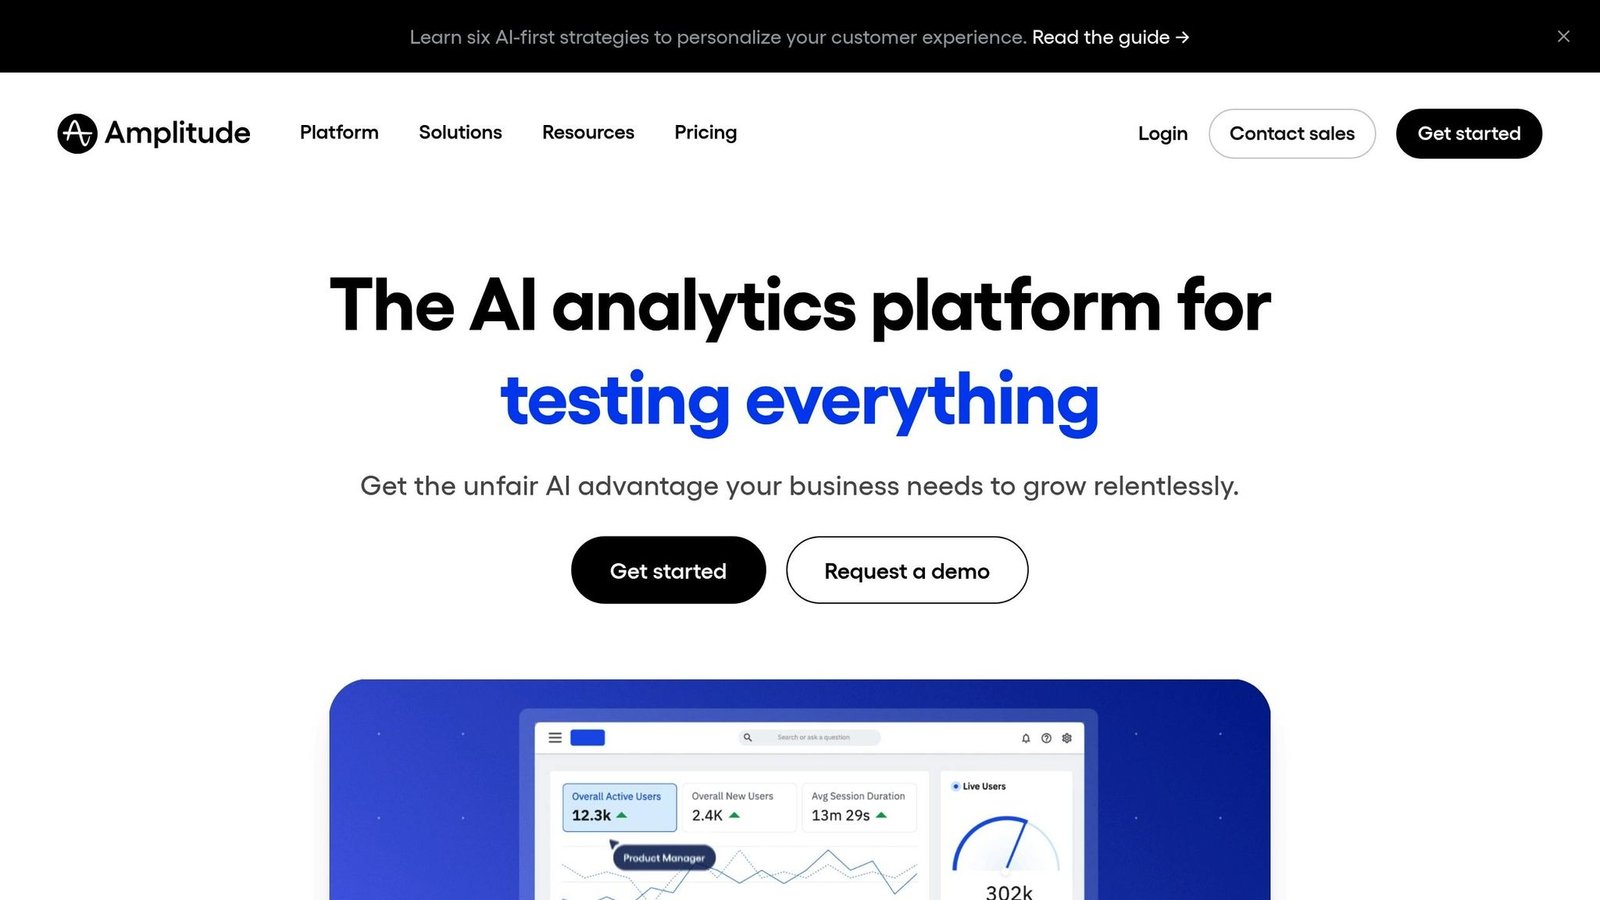
Amplitude stands out with behavioral analytics that help uncover the drivers behind subscription growth and retention. Features like Revenue LTV Charts, Compass Chart, and Funnel Analysis work together to highlight monetization trends and identify where users drop off. The Compass Chart, for instance, pinpoints “aha” moments by analyzing user behaviors that predict retention and growth.
Amplitude’s Lifecycle Analysis simplifies subscriber management by categorizing users into New, Current, Resurrected, and Dormant groups. Meanwhile, the Session Replay feature goes a step further by providing qualitative insights, showing actual user actions to help you understand why certain behaviors occur. This makes it easier to craft smarter strategies for boosting revenue.
The customer quotes and conversion percentages this section previously carried could not be sourced to a published case study, so they have been removed.
Platform Compatibility (iOS/Android)
Amplitude supports iOS and Android platforms through native SDKs, as well as mobile web, ensuring comprehensive cross-platform tracking. It also integrates with tools like Adapty and RevenueCat, automatically syncing in-app purchase events and revenue data. By using server-side verification, Amplitude minimizes errors caused by failed transactions or refunds, ensuring your analytics stay accurate.
Pricing and Affordability
Amplitude has moved to event-based pricing, so any figure you find quoting monthly tracked users is out of date. The Free plan covers 2 million events per month, indefinitely. The Plus plan also starts at $0 with the first 2 million events per month free and then scales with usage – it is pay-as-you-go rather than a fixed monthly subscription, so use the vendor’s bill estimator. Growth and Enterprise are custom-priced on the same event basis.
Early-stage startups with under $10 million in funding and fewer than 20 employees can apply for the Startup Scholarship, which grants one free year on the Growth plan. Amplitude also runs a Tech for Black Founders Scholarship offering free access to the Growth plan for qualifying organizations.
4. Mixpanel
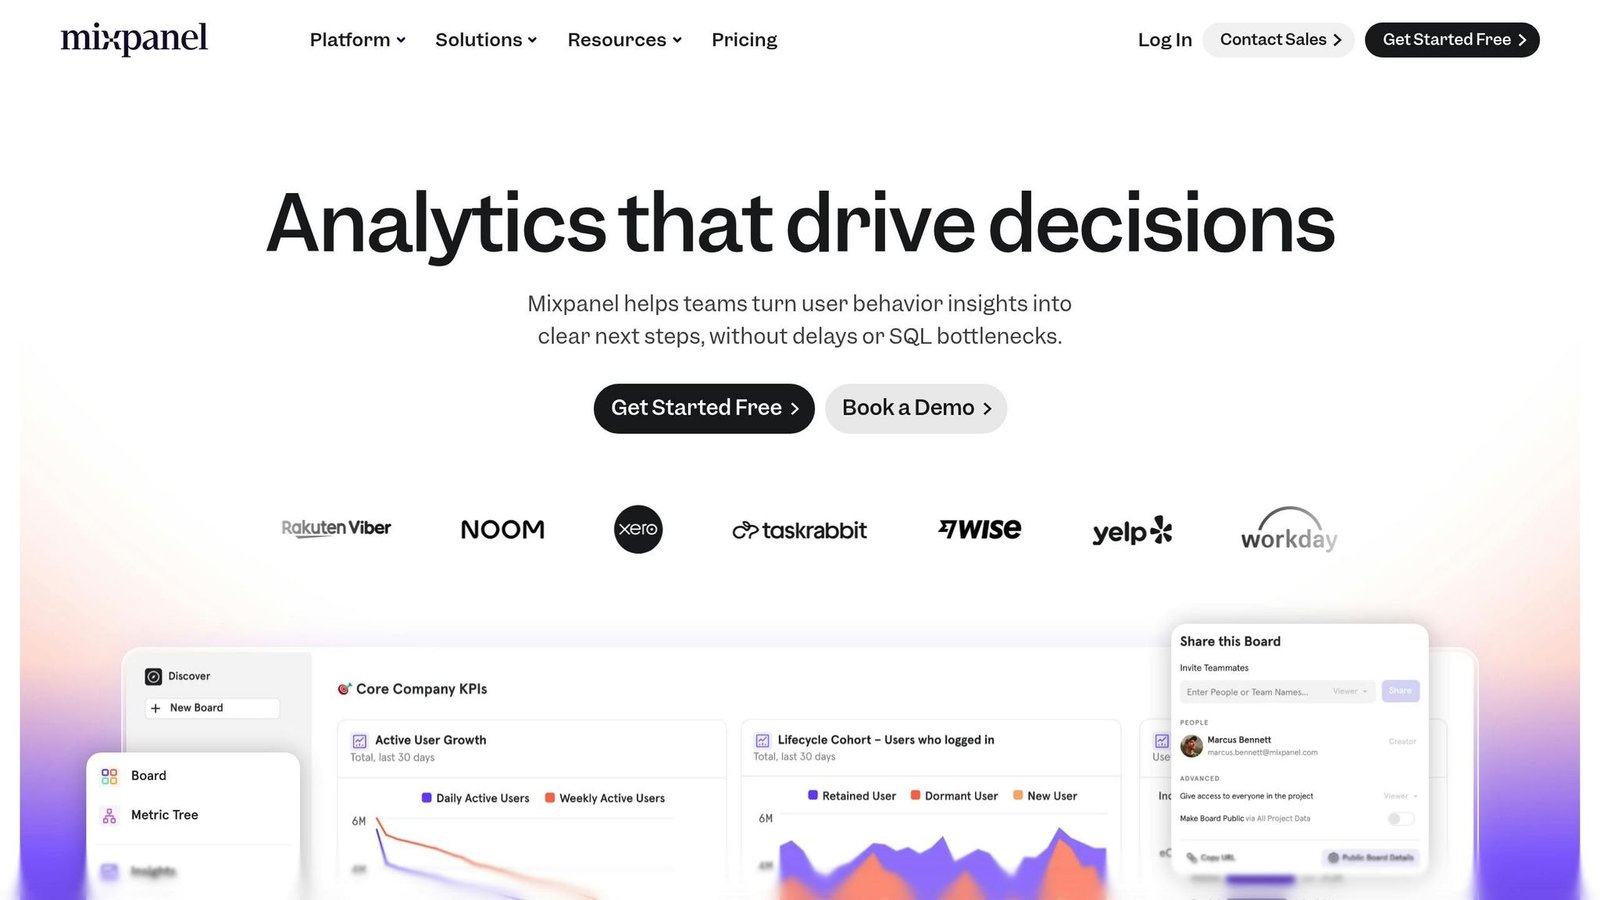
Mixpanel focuses on quantitative analytics, with a dedicated Revenue Analytics feature that ties product usage to financial outcomes. It tracks subscription metrics including Monthly Recurring Revenue (MRR), Annual Recurring Revenue (ARR), Net Revenue Retention (NRR), and MRR Churn, and categorizes revenue changes into New, Upgrade, Downgrade, Churn, or Flat.
Mixpanel integrates with RevenueCat to automatically monitor in-app subscription events, including trial starts, conversions, renewals, and billing issues, across both the Apple App Store and Google Play.
The customer testimonials and the active-user uplift figure previously quoted here could not be traced to a published source and have been removed.
Platform Compatibility (iOS/Android)
Mixpanel supports iOS and Android platforms with native SDKs for Swift, Objective-C, and Java. It tracks a wide range of subscription events, such as initial purchases, renewals, trial conversions, cancellations, and product changes, across both app stores. By syncing Mixpanel’s Distinct Id with RevenueCat’s App User Id, subscription events are accurately recorded. Additionally, with Warehouse Connectors in Mirror Mode, Mixpanel keeps data aligned with your data warehouse, even accounting for refunds and chargebacks.
Pricing and Affordability
Mixpanel’s Free plan includes up to 1 million monthly events and 10,000 monthly session replays at no cost. The Growth plan also starts at $0 and covers up to 20 million events and 500,000 session replays a month; it is priced per thousand events on a sliding volume scale, but Mixpanel does not publish that rate on its pricing page – you have to run its calculator, so treat any per-event figure quoted elsewhere with suspicion. Enterprise is custom-priced.
For early-stage companies founded less than five years ago with up to $8 million in total funding, and which have not redeemed another offer, the Startup Program gives the first year free on the Startup Plan.
5. Firebase Analytics
Firebase Analytics, a free tool from Google, is a go-to choice for small businesses and app developers looking to track subscriptions. By integrating the Firebase SDK, the platform automatically collects in-app purchase (IAP) events, including subscription-based transactions, from both the Apple App Store (supporting StoreKit 1 and 2) and Google Play Store. Once the SDK is added, basic tracking starts right away.
Analytics Capabilities for Subscription Metrics
Firebase Analytics tracks key subscription events like trial starts, renewals, cancellations, expirations, billing issues, and product changes. When paired with tools like RevenueCat, it becomes more useful still. The platform allows you to log up to 500 unique events for free, with unlimited reporting. For advanced analysis, you can export raw event data to BigQuery, enabling complex SQL queries.
Additionally, Firebase works with AdMob to combine subscription revenue and in-app advertising metrics, giving you a fuller view of your users’ Lifetime Value (LTV).
A game-studio case study quoting a specific revenue uplift from ad optimisation was previously cited here. We could not source it, so it has been removed. The mechanism it described is real enough on its own: Remote Config plus A/B testing lets you change interstitial ad frequency without shipping a new build, and the trade-off you are managing is ad revenue against retention. Whether that trade nets out in your favour depends on how much of your revenue is subscriptions rather than ads, which is exactly what you should measure before touching it.
Platform Compatibility (iOS/Android)
Firebase Analytics is compatible with multiple platforms, including iOS, Android, Web, Flutter, Unity, and C++. For iOS apps using StoreKit 2, developers can manually log verified purchases by calling Analytics.logTransaction(). The platform also offers real-time monitoring through tools like StreamView and DebugView, making it easy to track subscription events as they occur.
Pricing and Affordability
Firebase Analytics is free at its core, including unlimited event reporting. However, if you use BigQuery for storing and querying data, costs apply under Google Cloud’s “Blaze” pay-as-you-go plan. For small businesses or developers new to subscription analytics, the free tier provides the essential tools without upfront costs.
6. AppsFlyer
AppsFlyer connects marketing spend to subscription revenue across mobile, web, CTV, PC, and console.
Mobile Subscription Management Features
AppsFlyer helps businesses uncover their actual profits by calculating net revenue. It accounts for store commissions, taxes, refunds, and family sharing deductions. The platform uses CUID technology to connect mobile app installs with web-based purchases, making it easier to identify the campaigns driving subscription growth. Its OneLink deep linking feature ensures users are directed from any channel – email, social media, or even QR codes – straight to specific in-app content, such as a subscription plan.
The Protect360 fraud protection suite blocks bots and fake installs so budget is not spent on them. A named broadcaster case study quoting install and engagement uplifts was removed from this section because we could not source the figures.
Analytics Capabilities for Subscription Metrics
AppsFlyer tracks free trial starts, trial completions, paid subscriptions, renewals, and cancellations. Its predictive analytics forecast user actions and lifetime value, which lets marketers move campaign budget while a campaign is still running. Benchmark conversion rates and ROI multiples previously quoted here were vendor-reported without a linkable source and have been removed; ask AppsFlyer for the underlying methodology if a benchmark matters to your business case.
Platform Compatibility (iOS/Android)
AppsFlyer supports both iOS and Android with dedicated SDKs. It complies with privacy standards like SKAdNetwork, ATT, and Android 12+. The platform also supports Google Play billing measurement for accurate tracking across Android devices.
Pricing and Affordability
AppsFlyer offers three pricing options:
- Zero Plan: Free, aimed at apps using only owned media. Includes a Welcome Package with 12,000 free conversions for the first year, core marketing analytics, and 30 days of access to selected premium add-ons.
- Growth Plan: Pay-as-you-go. After the 12,000 free first-year conversions, conversions are priced at $0.07 each.
- Enterprise Plan: Custom pricing with cross-channel attribution, fraud prevention, and AI-driven insights.
7. UXCam
UXCam is a mobile-first analytics platform that blends numbers with real user insights. By using tools like session replays and heatmaps, it helps uncover why users act the way they do.
Mobile Subscription Management Features
UXCam makes it easier for developers to improve subscription conversions by identifying frustration points that often lead to user churn. It automatically detects behaviors like rage taps, unresponsive clicks, and excessive zoom-ins – common signs of user struggle during the subscription process. Retention and funnel analytics pinpoint where users drop off, while autocapture and user journey flows provide a clear picture of navigation patterns. To look more closely at user behavior, sessions can be segmented by duration – short (under 10 minutes), moderate (10–20 minutes), and long (over 20 minutes). Comparing heatmaps across these groups reveals which parts of the interface keep users engaged longer.
Analytics Capabilities for Subscription Metrics
UXCam’s dashboard brings together numbers and context, making it simple for non-technical teams to understand and act on insights. A built-in collaboration feature lets users tag teammates and flag usability issues directly within session recordings.
An anonymous first-name-only review was previously quoted here as evidence. It has been removed: an unattributable testimonial tells you nothing.
Platform Compatibility (iOS/Android)
UXCam is compatible with both iOS and Android through dedicated SDKs. It also works with frameworks like React Native, Cordova, Xamarin, Flutter, and Nativescript. It is built exclusively for mobile apps.
Pricing and Affordability
UXCam does not publish its rates. Pricing is based on your monthly session volume and quoted individually, and the site asks you to submit a form for a custom quote. There is a free trial with full feature access, though UXCam does not state its length on the pricing page. Session-count thresholds and plan feature lists that this article previously carried could not be found on the vendor’s site and have been removed. If session volume is your cost driver, get the quote before you build UXCam into a budget.
Comparison Table
Here’s a quick overview of pricing, supported platforms, and key features for mobile subscription tools:
| Tool Name | Best For | Platforms | Starting Price (USD) | Key Mobile Subscription Features |
|---|---|---|---|---|
| RevenueCat | Indie developers & small businesses | iOS, Android, Web | Free under $2,500 MTR, then 1% of MTR | In-app purchase infrastructure, receipt validation, cross-platform insights |
| ChartMogul | SaaS businesses tracking MRR | iOS, Android, Web | Free under $10K MRR; Starter $59–$515/mo; Pro $99–$1,199/mo | Revenue recognition, cohort analysis, subscription metrics |
| Amplitude | Deep behavioral & product analytics | iOS, Android, Web | Free to 2M events/mo; usage-based above | User journey mapping, event-based segmentation, retention tracking |
| Mixpanel | Advanced user segmentation | iOS, Android, Web | Free to 1M events/mo; Growth volume-priced | Funnel analysis, retention tracking, real-time data |
| Firebase Analytics | General app analytics | iOS, Android | Free (BigQuery billed separately) | Event tracking, audience segmentation, Google ecosystem integration |
| AppsFlyer | Ad performance and attribution | iOS, Android | Free Zero plan; then $0.07 per conversion | Attribution tracking, campaign analytics, ROI measurement |
| UXCam | User experience optimization | iOS, Android | Not published – quote only | Session replays, heatmaps, funnel analysis, rage tap detection |
This table highlights the main differences, but let’s break it down further to help you choose the right tool for your app.
RevenueCat, ChartMogul, Amplitude, Mixpanel, Firebase Analytics and AppsFlyer all have genuine free tiers, which makes them accessible for smaller projects or early-stage apps. UXCam is the outlier here: it publishes no rates at all, so you cannot compare it on cost without contacting sales. That is worth knowing before you shortlist it.
For apps running on multiple platforms, RevenueCat is good for consolidating purchase data across iOS and Android. Tools like Amplitude and Mixpanel go beyond basic analytics by combining user behaviour data with subscription metrics. Meanwhile, Firebase Analytics is a no-cost option for developers who want straightforward event tracking that connects with other Google tools.
If your focus is on marketing performance, AppsFlyer is the one built for linking ad campaigns to subscription conversions. Use this guide to align your app’s goals with the tool that best fits your needs. For a deeper look at the bigger picture, check out our guide on subscription lifecycle management.
Conclusion
Picking the right mobile subscription analytics tool comes down to three things: your current revenue, the technical depth of your team, and what you actually want to change. Most of these platforms – RevenueCat, Amplitude, Mixpanel, Firebase Analytics and AppsFlyer – have free tiers generous enough to run a real pilot rather than a demo.
Each tool serves a distinct purpose. RevenueCat and ChartMogul give a unified view of subscription metrics across platforms. If you want to understand why users convert or churn, Amplitude and Mixpanel are the stronger choices. For teams already inside Google’s ecosystem, Firebase Analytics is the path of least resistance. And if tracking ROI for paid ad campaigns is the priority, AppsFlyer is the one that breaks performance down at ad level.
One caution on pricing across this whole category: several vendors here have moved from user-based to event-based billing in recent years, and two of them no longer publish a per-unit rate at all. Any comparison article, including this one, goes stale quickly. Check the vendor’s own page before you commit.
Start by exploring free tiers or trials to evaluate how easy the setup is and whether the dashboards meet your needs. From there, choose the tool that aligns best with your immediate goals – whether it’s tracking revenue, analyzing user behavior, or managing marketing attribution. As your app grows, revisit your analytics strategy to ensure it still fits your evolving business.
If your focus extends beyond app analytics and into broader business subscription management, BizBot (https://bizbot.com) is a great option for keeping track of expenses across your software tools.
FAQs
How can I choose the best mobile subscription analytics tool for my app?
To find the right mobile subscription analytics tool for your app, start by determining the specific insights you need regarding revenue and user behavior. Key metrics to prioritize include monthly recurring revenue (MRR), churn rate, renewal rates, and lifetime value (LTV). Tools featuring real-time dashboards with filtering options – such as by platform (iOS, Android, web) or acquisition channels – can be especially useful for making quick, informed decisions.
Next, assess how the tool integrates with your app. Most platforms rely on lightweight SDKs to automatically track subscription events from app stores or payment processors. If your app requires advanced features like custom reporting or combining subscription data with other app metrics, choose a tool that offers flexible dashboards or API access for deeper customization.
Lastly, consider the pricing and scalability of the tool. Many platforms provide free tiers or trial periods, which are great for small businesses looking to get started without upfront costs. Look for tools with transparent pricing in USD, clear upgrade paths, and responsive customer support to help you refine your subscription strategy. By matching these features to your app’s goals, you can select a tool that effectively aids in growth and user retention.
What are the main differences between free and paid analytics tools for mobile subscriptions?
Free versions of mobile subscription analytics tools usually provide the basics: app installs, session metrics, and simple event tracking. These features are helpful for beginners but often fall short when it comes to in-depth revenue analysis or scaling a business.
Paid plans add tools like custom dashboards, predictive analytics, and detailed revenue forecasting. They often include longer data retention, integrations with CRMs or BI tools, and priority customer support. For small developers, starting with a free plan is a sensible way to test the platform, with the option to upgrade as requirements grow.
Do these tools work with marketing and financial platforms I already use?
Yes, many mobile subscription analytics tools are built to work with widely used marketing platforms, including CRMs and ad networks, as well as financial systems like payment gateways and accounting software such as QuickBooks or Xero.
These connections help simplify your processes, keep data consistent across platforms, and give you a complete picture of your subscription performance alongside your marketing and financial data.
More on this topic
Browse all 53 articles on Data & Analytics.