Inventory analytics is all about using data to improve how businesses manage their stock. Without the right metrics, companies risk losing money to excess inventory, stockouts, or high carrying costs. The article highlights 10 key metrics that help businesses streamline inventory management, reduce costs, and improve decision-making. Here's a quick overview:
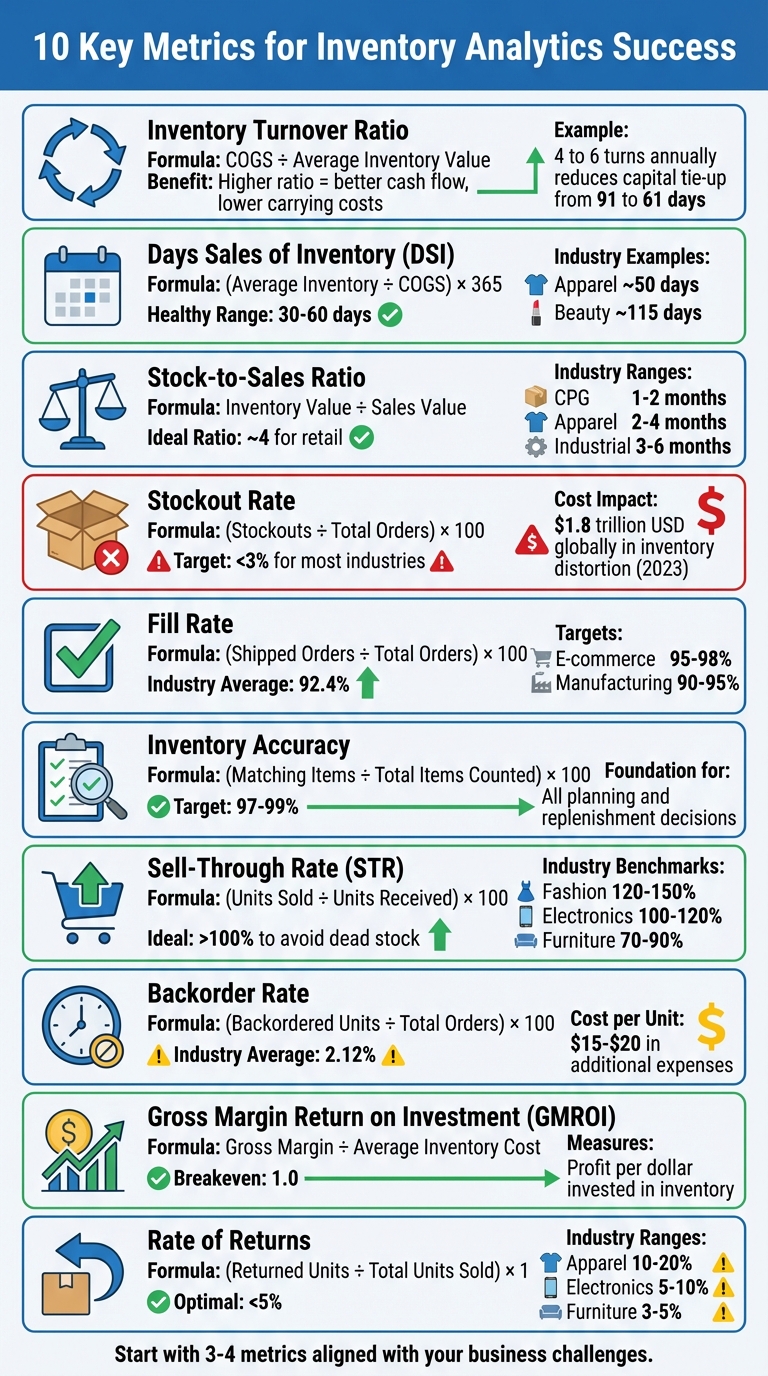
- Inventory Turnover Ratio: Tracks how often inventory is sold and restocked. A higher ratio means better cash flow and reduced carrying costs.
- Days Sales of Inventory (DSI): Measures how long stock stays unsold. Lower DSI improves liquidity but must balance against stockout risks.
- Stock-to-Sales Ratio: Compares inventory levels to sales. Helps identify overstocking or stockout risks.
- Stockout Rate: Tracks the percentage of unfulfilled orders. High rates indicate poor inventory planning.
- Fill Rate: Measures how well customer demand is met from available stock. High rates reflect efficient inventory management.
- Inventory Accuracy: Ensures digital records match physical stock. Accurate records prevent costly errors.
- Sell-Through Rate (STR): Shows how much inventory is sold versus received. High STR indicates strong demand and reduced dead stock.
- Backorder Rate: Tracks delayed orders due to insufficient stock. High rates signal supply chain or planning issues.
- Gross Margin Return on Investment (GMROI): Calculates profit per dollar of inventory. Helps prioritize profitable items.
- Rate of Returns: Measures the percentage of returned items. High return rates highlight quality or description issues.
These metrics, when monitored effectively, provide the foundation for better forecasting, cost control, and customer satisfaction. Start by focusing on a few key metrics that align with your business challenges and use automated tools for real-time tracking and insights.
10 Essential Inventory Analytics Metrics for Business Success
Top 15 Inventory Metrics Every Supply Chain Professional Must Know | Formulas & Business Impact
sbb-itb-d1a6c90
1. Inventory Turnover Ratio
The inventory turnover ratio tells you how many times your business sells and restocks its inventory within a specific period. To calculate it, divide your cost of goods sold (COGS) by your average inventory value. This metric provides insight into how efficiently your stock is contributing to revenue generation.
Relevance to Inventory Performance
"Inventory turnover reveals how efficiently you convert investments into sales." – Bizowie
This ratio is crucial for determining whether you're managing your inventory wisely or tying up too much capital in unsold products. For instance, increasing your turnover from four to six times annually shortens the time your capital is tied up - from 91 days down to 61 days. Since inventory often represents the largest asset on a company’s balance sheet, improving this ratio can significantly boost cash flow.
Better inventory turnover isn't just about freeing up cash - it also directly impacts your operational efficiency.
Impact on Operational Efficiency
Higher turnover means lower carrying costs and less risk of products becoming obsolete. Moving inventory faster reduces the chance of items sitting on shelves too long, which helps maintain their value and supports timely sales.
This improved efficiency has a ripple effect, especially when it comes to making smarter business decisions.
Ability to Inform Decision-Making
Tracking this ratio can help you spot underperforming products. If certain SKUs aren’t selling as expected, it might signal the need for markdowns, discounts, or bundling strategies. For businesses with seasonal demand, reviewing monthly turnover data can help refine your planning and ensure you're stocking the right amount at the right time.
Ease of Measurement and Tracking
Accurate tracking is essential to unlock the benefits of this metric. Modern inventory management systems make it easier by providing real-time turnover data at various levels - whether for the entire company, specific categories, or individual SKUs. These systems pull data directly from standard financial records like income statements and balance sheets.
One key tip: ensure consistency when calculating this ratio. Both COGS and average inventory should be measured at cost, not retail price. Keep in mind that optimal turnover rates vary widely by industry. For example, grocery stores often exceed 15 turns annually, while jewelry retailers might only need 1–2.
2. Days Sales of Inventory (DSI)
Days Sales of Inventory (DSI) measures how many days, on average, it takes for a company to convert its inventory into sales. Also referred to as days inventory outstanding (DIO) or the average age of inventory, this metric provides a daily perspective on inventory performance, offering more clarity compared to turnover ratios. When combined with other metrics, it helps paint a detailed picture of inventory flow.
Relevance to Inventory Performance
"The days sales of inventory (DSI) is a measure of the liquidity of a firm's inventory - that is, how long it takes a company to turn its inventory into sales." - Investopedia
DSI is calculated by dividing the average inventory by the cost of goods sold (COGS) and then multiplying the result by 365 days. For example, using fiscal 2024 data, a company with $54.9 billion in inventory and $490 billion in COGS would have a DSI of 40.9 days. A healthy DSI generally falls between 30 and 60 days, though this varies by industry. Apparel companies, for instance, average about 50 days, while beauty and cosmetics businesses often see higher numbers, closer to 115 days.
Impact on Operational Efficiency
A lower DSI means faster cash conversion, which improves liquidity and reduces the amount of capital tied up in inventory. Keeping DSI within an optimal range safeguards profitability. However, driving DSI too low can lead to stockouts and missed sales opportunities. Striking the right balance is crucial.
Ability to Inform Decision-Making
DSI is a valuable tool for making timely decisions. For example, if certain SKUs show a DSI exceeding 120 days, it might be time to consider strategies like price markdowns, bundling, or bulk sales to clear excess inventory. Calculating DSI at the SKU level helps identify underperforming items. A rising DSI can signal weak demand or over-ordering, prompting adjustments in pricing or inventory management. Additionally, this metric aids demand forecasting by showing how long current stock will last based on actual sales trends.
Ease of Measurement and Tracking
DSI is relatively simple to calculate using data from the balance sheet (inventory value) and income statement (COGS). Modern inventory management systems can automate this calculation and provide real-time tracking. Regularly comparing your DSI to industry benchmarks can help catch potential issues early. For greater accuracy, calculate average inventory as (Beginning Inventory + Ending Inventory) ÷ 2.
3. Stock-to-Sales Ratio
The stock-to-sales ratio measures how much inventory you have compared to your sales over a specific period. To calculate it, simply divide your inventory value by your sales value. For instance, if your inventory is valued at $200,000 and your sales last month totaled $50,000, your ratio would be 4. This means you're holding about four months' worth of inventory based on your current sales pace.
This ratio, like other key performance indicators (KPIs), offers practical insights into managing and optimizing your inventory.
Relevance to Inventory Performance
The stock-to-sales ratio acts as a quick barometer of inventory health, complementing metrics like liquidity and turnover. A ratio of around 4 is often seen as a good balance for retail businesses, ensuring enough stock to meet demand without tying up too much cash in storage. However, what’s considered "healthy" varies across industries. For example:
- Consumer packaged goods typically aim for a ratio of 1–2 months.
- Apparel businesses usually operate with 2–4 months of inventory.
- Industrial companies often hold 3–6 months of stock.
A high ratio might signal overstocking, which can increase carrying costs - ideally kept below 25% of inventory value. On the other hand, a low ratio could indicate a risk of stockouts, leading to missed sales opportunities.
Impact on Operational Efficiency
Keeping your stock-to-sales ratio within an optimal range can help cut costs in several areas. It can lower warehouse expenses, reduce the labor needed to manage excess inventory, and free up capital that would otherwise be tied up in unsold goods. When the ratio is too high, you might face additional costs for storage, insurance, and labor. Conversely, a ratio that’s too low can result in stockouts, which not only disrupt operations but also hurt revenue.
Ability to Inform Decision-Making
This metric is a valuable tool for fine-tuning your purchasing strategy. If your ratio is consistently above industry standards, it might be time to address slow-moving items by offering discounts, bundling products, or running bulk sales. During periods of rapid growth, a temporarily higher ratio might be acceptable to meet future demand. Additionally, tracking this ratio can help you decide when to divert capital to other areas instead of keeping it tied up in stagnant inventory.
Ease of Measurement and Tracking
Calculating the stock-to-sales ratio is straightforward. You'll need data from your balance sheet (inventory value) and income statement (sales figures). Many modern inventory systems and ERP platforms can automate this process, providing real-time updates. Regularly monitoring this ratio can help you identify seasonal trends or sudden inventory buildups, allowing you to adjust proactively and avoid potential cash flow problems.
4. Stockout Rate
The stockout rate represents the percentage of orders that go unfulfilled due to insufficient inventory. To calculate it, divide the number of stockouts by the total number of orders, then multiply by 100. For example, if 15 out of 500 orders result in stockouts, the stockout rate would be 3%. This metric provides insight into how effectively your inventory meets customer demand.
Relevance to Inventory Performance
Much like turnover ratios, the stockout rate is a critical measure of how well supply aligns with demand. It highlights your ability to fulfill customer orders and maintain reliable service levels. In 2023, inventory distortion - which includes both stockouts and overstocking - cost retailers around $1.8 trillion USD globally. Acceptable stockout rates vary depending on the industry: grocery stores typically range between 1% and 3%, while e-commerce businesses often aim for 2% to 4%. In these sectors, a stockout rate above 3% signals potential risks that need addressing.
Impact on Operational Efficiency
Stockouts do more than just inconvenience customers - they can significantly increase operational costs. When inventory runs out, businesses often face expenses related to expedited shipping, backorder management, and refunds. Additionally, stockouts can push customers toward competitors, harm your brand’s reputation, and result in costly emergency purchases that eat into profit margins.
Ability to Inform Decision-Making
Tracking your stockout rate can reveal whether your inventory practices are overly lean. A consistently high rate is a red flag, indicating the need to adjust reorder points or increase safety stock to handle demand spikes and supply chain disruptions. By analyzing stockout rates at the product level, businesses can fine-tune their inventory strategies to better align with customer needs.
Ease of Measurement and Tracking
Calculating the stockout rate is simple - just track the number of unavailable items alongside total orders or shipments. Automated inventory systems make this process even easier by monitoring stock levels, alerting you when inventory falls below critical thresholds, and streamlining reorder planning. These tools ensure businesses can respond quickly and maintain optimal stock levels.
5. Fill Rate
Building on our earlier discussion about stockout rates, fill rate provides another lens to assess how well customer demand is being met.
Fill rate represents the percentage of customer orders that are fulfilled immediately from available stock. To calculate it, divide the number of shipped orders by the total orders placed, then multiply by 100. For instance, if you ship 920 out of 1,000 orders, your fill rate is 92%.
Why Fill Rate Matters for Inventory Performance
Fill rate connects inventory levels with revenue by showing how much demand gets converted into immediate sales. On average, industries aim for a fill rate of around 92.4%. E-commerce businesses often achieve fill rates between 95% and 98%, while manufacturing operations usually target rates from 90% to 95%. A high fill rate is a sign of effective inventory management and a well-functioning supply chain. On the flip side, a low fill rate can lead to missed sales opportunities and damage customer trust.
How It Affects Operational Efficiency
When fill rates dip, businesses face added costs like backorders, expedited shipping, and increased customer service efforts. A high fill rate, however, indicates that your supply chain is operating efficiently and that inventory planning aligns with customer demand.
Using Fill Rate to Guide Decisions
Fill rate data can help you set service goals tailored to different product categories. For example, aim for a 98% fill rate for high-priority items (A-items), 95% for mid-priority items (B-items), and 90% for lower-priority items (C-items). If your fill rates consistently fall short of these goals, it may signal issues with demand forecasting or insufficient safety stock. Automated reorder alerts - triggered when inventory drops to 10–20% of forecasted demand - can help prevent stockouts and protect your revenue.
Tracking and Measuring Fill Rate
Fill rate is straightforward to calculate using your inventory system, which tracks the ratio of shipped items to total orders. You can monitor this metric at various levels, such as by individual delivery, specific product lines, or your entire catalog. Many businesses use dashboards to track fill rates weekly or monthly and implement a traffic-light system (green, yellow, red) to flag performance issues that need immediate attention.
6. Inventory Accuracy
Inventory accuracy reflects how well your digital inventory records match your actual physical stock. To calculate it, divide the number of items that match your records by the total items counted, then multiply by 100. For instance, if you count 970 items and 950 align with your system, your accuracy rate is 97.9%. This metric is crucial because it serves as the backbone for dependable forecasting and decision-making.
Relevance to Inventory Performance
"Inventory Record Accuracy (IRA) is the foundation for all planning and replenishment decisions." - Umbrex
Accurate inventory data is the cornerstone of effective inventory management. Without it, other performance metrics lose their reliability. Your ability to forecast demand, make purchasing decisions, and streamline operations depends on knowing exactly what’s in stock. Industry benchmarks vary: retail businesses aim for 97% to 99%, healthcare facilities target 98% to 99.5%, and food and beverage companies typically shoot for 95% to 97%. Experts recommend reaching at least 97% accuracy before introducing advanced inventory management tools.
Impact on Operational Efficiency
Inaccurate inventory records can lead to wasted time searching for misplaced items, unplanned recounts, and increased costs due to theft, damage, or administrative errors. High accuracy helps avoid tying up capital in surplus stock and prevents revenue losses caused by stockouts.
Ability to Inform Decision-Making
When your inventory records are accurate, management can confidently base purchasing and supply chain decisions on system data rather than guesswork. Reliable records help determine reorder points, safety stock levels, and which items to discontinue. Businesses with dead stock exceeding 25% to 30% - a common result of poor accuracy - risk falling behind competitors. Accurate data is essential for advanced inventory strategies and optimizations.
Ease of Measurement and Tracking
Maintaining inventory accuracy doesn’t have to disrupt daily operations. Cycle counting - checking a small group of items daily or weekly - can keep accuracy in check without requiring a full physical inventory. Focus on high-value items using ABC analysis for more frequent checks. Tools like barcode scanners and RFID systems minimize manual errors and provide real-time updates. Lastly, ensure all teams work from a single source of truth, such as an ERP or warehouse management system, to maintain consistency.
7. Sell-Through Rate
Sell-through rate (STR) is a straightforward metric that shows the percentage of inventory sold compared to the amount received from suppliers within a set period. The formula is simple: (units sold ÷ units received) × 100. For instance, if you receive 500 units and sell 450, your STR would be 90%. Because it only requires two data points, STR is one of the easiest metrics to track. It provides a clear view of product demand and inventory efficiency.
Relevance to Inventory Performance
STR is an essential indicator when evaluating inventory performance. A high STR reflects strong customer demand and efficient inventory turnover, while a low STR may point to sluggish sales or overstocked items. Benchmarks for STR vary by industry: fashion typically aims for 120% to 150%, electronics for 100% to 120%, and furniture for 70% to 90%. In general, maintaining a rate above 100% is ideal to avoid excess inventory and dead stock.
Impact on Operational Efficiency
Keeping an eye on STR can help businesses identify slow-moving products early, preventing them from turning into dead stock. Dead stock not only ties up valuable storage space but also incurs holding costs, often about 30% higher than the product's original value. By spotting underperforming items, businesses can take quick action, such as offering discounts, creating bundles, or cutting future orders, to optimize space and reduce costs.
Ability to Inform Decision-Making
STR becomes even more valuable when paired with other inventory metrics. It highlights which products deserve more focus or should be phased out, enabling precise adjustments to purchasing strategies. Using historical STR data alongside storage cost figures can provide a clearer picture of the financial impact of holding specific items. This data helps fine-tune demand forecasts, automate reorder points for fast-selling products, and align supply chain operations with customer demand in real time.
Ease of Measurement and Tracking
Tracking STR is seamless with modern ERP systems, as they automatically log purchase orders and sales data. Oded Harth, CEO & Co-Founder of MDacne, underscores the role of automation in inventory management:
"ShipBob's analytics tool... helps us a lot with planning inventory reorders, seeing when SKUs are going to run out, and we can even set up email notifications so that we're alerted when a SKU has less than a certain quantity left."
To ensure accuracy, regular physical inventory counts remain essential. Modern tools make it easier than ever to stay on top of sell-through rates and make data-driven decisions.
8. Backorder Rate
The backorder rate tracks the percentage of orders that face delays at the time of purchase. To calculate it, divide the number of backordered units by the total number of orders, then multiply by 100. For instance, if 200 orders come in but only 190 can be shipped immediately, the backorder rate is 5%. Ideally, businesses aim for this rate to be as close to 0% as possible, though the industry average sits around 2.12%. This metric offers a quick snapshot of how well inventory aligns with demand.
Relevance to Inventory Performance
When it comes to managing in-demand products, the backorder rate is especially important. A high rate can point to issues like weak supply chain management, poor planning, or inaccurate demand forecasting. Benchmarks vary by industry: consumer electronics companies should aim for 1% to 3%, apparel retailers 2% to 5%, and industrial suppliers 5% to 10%. If the rate exceeds 5%, it often highlights serious inventory management challenges.
Impact on Operational Efficiency
Handling backorders isn’t just inconvenient - it’s expensive. Each backordered unit can add $15–$20 in costs for labor, shipping, and customer service. While keeping inventory lean might seem like a cost-saving measure, it can lead to these hidden expenses and risk driving customers to competitors.
Ability to Inform Decision-Making
Analyzing backorder trends can help fine-tune key inventory parameters like reorder points, safety stock, and lead times. This data can uncover supplier delays, unexpected demand surges, or forecasting mistakes. Just as with stockout and fill rate metrics, using backorder insights allows businesses to balance the cost of carrying extra inventory with the risk of stockouts. For high-demand items, increasing safety stock by 10% to 20% of forecasted demand can reduce recurring backorders.
Ease of Measurement and Tracking
The backorder rate is simple to calculate using order data from most inventory management systems. Many modern platforms can automate reorder alerts when high-demand items drop below 20% of their usual stock levels. Real-time tracking also makes it easier to restock proactively and avoid backorders altogether. If selling on backorder is unavoidable, clear and honest communication about delivery timelines can help maintain customer trust.
9. Gross Margin Return on Investment (GMROI)
GMROI is a key inventory metric that sheds light on profitability and operational efficiency. Gross Margin Return on Investment (GMROI) measures the profit generated for every dollar invested in inventory. To calculate it, divide the gross margin (total sales minus the cost of goods sold) by the average inventory cost. For instance, if your gross margin is $55,000 and your inventory costs $30,000, your GMROI would be 1.83. This means you’re earning $1.83 for every dollar spent on inventory. A GMROI of 1.0 indicates that the business is breaking even on its inventory investment. Beyond profitability, this metric plays a vital role in shaping inventory strategies.
Why GMROI Matters for Inventory Performance
GMROI bridges the gap between inventory costs and profits, answering the question: How much profit does each dollar of inventory generate? By analyzing GMROI at the product level, businesses can pinpoint which items are driving profits and which are consuming cash without delivering adequate returns.
"I look at my stock inventory every Monday morning, and the first thing I look at are my most profitable products. I apply the 80/20 rule, or Pareto principle, in that 20% of my product provide 80% of my profitability, so I focus on this 20% of products first." – Adam Watson, Managing Director of Hollywood Mirrors
Enhancing Operational Efficiency
This metric is also invaluable for identifying slow-moving or dead inventory - products that take up space and tie up working capital without contributing to profits. For businesses with limited warehouse space, GMROI can guide decisions on how to maximize profit per square foot by prioritizing high-return items.
A Tool for Smarter Decision-Making
GMROI extends beyond inventory monitoring to inform purchasing and pricing strategies. It highlights high-return product lines, helping businesses decide whether to increase markups, liquidate underperformers, or bundle slow-moving SKUs to free up resources. Unlike inventory turnover, which focuses solely on how quickly items sell, GMROI ensures that fast-selling products are also profitable.
Easy to Measure and Track
Thanks to modern point-of-sale and retail management systems, calculating GMROI has become straightforward. These systems pull data from income statements and balance sheets, automating the process. Regular reviews, such as weekly checks, allow businesses to stay ahead of declining margins and adjust ordering strategies accordingly. Platforms like BizBot offer accessible tools that simplify inventory management, making GMROI tracking more manageable for businesses of all sizes.
10. Rate of Returns
The rate of returns reflects the percentage of shipped items that customers send back. It’s calculated by dividing the number of returned units by the total units sold, then multiplying by 100. This metric sheds light on potential problems with product quality, shipping, or descriptions. Like other key metrics, understanding return rates is crucial for maintaining profitability while keeping operations efficient.
Relevance to Inventory Performance
Returns can take a big bite out of profits. Each return reduces net sales and adds reverse logistics costs, which typically range from $15–$20 per unit. High return rates not only increase expenses but also tie up capital in unsellable inventory, which risks becoming dead stock or needing liquidation. Additionally, returned items take up warehouse space, driving up carrying costs that usually account for 20% to 30% of total inventory value. These factors can ripple through inventory management, affecting overall profitability.
Return rates vary widely by industry. For instance, apparel return rates often range from 10% to 20%, consumer electronics hover between 5% and 10%, and furniture averages around 3% to 5%. Generally, keeping return rates below 5% is considered optimal for protecting profit margins.
Impact on Operational Efficiency
Handling returns creates extra work, requiring resources for inspection, re-categorization, or repairs. This added workload can reduce capacity for processing new orders. High return rates also inflate Customer Acquisition Costs (CAC), as marketing efforts may not lead to sustained sales if customers frequently return products.
Ability to Inform Decision-Making
Analyzing return data can provide valuable insights for improving inventory management. Break down returns by vendor, product, color, or size, and categorize the reasons - whether it’s shipping damage, incorrect items, or poor quality. If specific SKUs consistently see high return rates, you might need to stop restocking them, improve their quality, or adjust their product descriptions to better align with customer expectations. Reviewing this data alongside gross margin figures can also help determine whether it’s more cost-effective to liquidate frequently returned items rather than keep them in stock.
Ease of Measurement and Tracking
Modern systems make tracking returns easier by syncing data across sales channels, ensuring sellable inventory counts remain accurate and reducing the risk of overselling. The calculation itself is straightforward, and sudden spikes in return rates can serve as red flags for quality issues or misleading product descriptions that need immediate attention.
Conclusion
Tracking the right metrics throughout your operations transforms guesswork into informed, data-driven decisions. As Guilherme Alt, Chief of Staff and Interim COO at Flieber, aptly states:
"If you can't measure it, you can't manage it."
The ten KPIs outlined earlier provide a clear picture of stock levels, capital allocation, and operational performance. Without reliable data, critical processes like forecasting, replenishment, and decision-making can falter. These metrics lay the groundwork for actionable improvements.
Start by assessing your current practices. Aim for inventory record accuracy of at least 97%. Relying on manual reconciliation can lead to missed opportunities to enhance cash flow and trim carrying costs. Focus on 3–4 key metrics that address your most pressing challenges, whether it’s frequent stockouts, excessive dead stock, or sluggish inventory turnover. Reducing dead stock is essential for staying competitive.
Streamline your systems to create a unified source of truth across all channels. Automated dashboards can then provide real-time insights into metrics like fill rates, shrinkage, and GMROI. Use visual indicators - such as green, yellow, and red thresholds - to quickly spot issues and resolve them within 48 hours.
For more advanced analytics, platforms like BizBot offer a range of business solutions. Whether you need accounting software or management tools, BizBot helps freelancers, small businesses, and growing companies find intuitive options tailored to their needs.
FAQs
What are the best inventory metrics businesses should focus on?
When selecting inventory metrics, it's essential to align them with your business goals - whether that's boosting efficiency, cutting costs, or improving customer satisfaction. Metrics like the inventory turnover ratio reveal how quickly your stock is sold and replenished, while days of inventory on hand (DOH) sheds light on liquidity and operational performance. Another critical metric, the stockout rate, helps you monitor service levels and minimize missed sales opportunities.
By focusing on a handful of metrics that directly support your priorities, you can keep your efforts streamlined and impactful. For instance, if reducing excess inventory is your objective, tracking turnover rates and DOH can highlight areas of inefficiency. Using inventory management tools can also simplify the process, offering actionable insights to guide smarter decision-making.
What tools can help automate tracking key inventory metrics?
To keep a close eye on essential inventory metrics - like turnover rates, stock levels, and demand forecasts - businesses can turn to inventory management software. Solutions such as NetSuite, QuickBooks Commerce, and Microsoft Dynamics offer automated tracking features that make life easier. These tools handle tasks like real-time inventory updates, demand forecasting, and sending low-stock alerts, helping businesses stay on top of their inventory needs.
For an extra edge, AI-driven platforms like StockIQ analyze data trends to fine-tune inventory levels. This helps businesses strike the right balance between costs and supply requirements. With these tools, managing inventory becomes more straightforward, allowing for smarter decisions that enhance overall operations.
Why are industry benchmarks important for understanding inventory metrics?
Industry benchmarks play a key role in understanding inventory metrics. They act as a reference point, letting you see how your business stacks up against others in your field. By leveraging these benchmarks, you can assess critical metrics like inventory turnover rates, stock levels, and demand forecasting accuracy to determine whether your performance is ahead of, behind, or in line with industry standards.
For instance, if your turnover rate is lower than average, it might point to overstocking or sluggish inventory movement. On the flip side, a higher turnover rate could mean strong sales - but it might also hint at potential stock shortages. Benchmarks not only highlight areas that need attention but also help you set achievable targets and fine-tune strategies like replenishment planning and demand forecasting. By aligning your inventory management with proven practices, you can better control costs, streamline stock levels, and keep your customers happy.