As part of a comprehensive ETL process, error logging ensures data pipelines run smoothly by identifying and resolving issues efficiently. Without proper logging, errors can lead to costly downtime and poor decisions. Here's what you need to know:
- Why It Matters: Companies face an average of 67 data incidents per month in 2026, with resolution times jumping 166% year-over-year. Proper logging reduces disruptions by up to 40%.
- Key Practices:
- Use structured logs with levels like DEBUG, INFO, WARN, and ERROR to prioritize issues.
- Include metadata (timestamps, IDs) for better diagnostics.
- Standardize formats (e.g., JSON) for easier analysis.
- Error Handling:
- Real-time monitoring tools like Grafana or CloudWatch catch issues early.
- Tiered alerts ensure critical errors get immediate attention while minor ones can wait.
- Retry logic with exponential backoff resolves 80% of temporary errors.
- Data Isolation:
- Dead-letter queues and error tables prevent bad data from affecting clean datasets.
- Quarantine zones allow safe correction and reintegration of flawed records.
Effective ETL error logging minimizes downtime, reduces manual troubleshooting, and improves overall data quality. Start by adopting structured logging, real-time monitoring, and automated handling strategies to keep your pipelines reliable.
Creating Logging Tables For ETLS - SQL Best Practices
sbb-itb-d1a6c90
How to Structure ETL Logs
Structured logs can turn hours of troubleshooting into mere minutes. In fact, organizations that focus on log analysis have reported a 20–30% boost in operational efficiency. Moreover, adopting structured logging can cut troubleshooting time by around 30%.
Log Levels and Categories
Log levels act like a triage system for your ETL pipeline, helping you prioritize and manage log data effectively. Here’s how they work:
- DEBUG: Captures detailed diagnostics, like variable states or loop iterations. Useful for development but too verbose for production.
- INFO: Tracks the general flow of operations, such as "Start Extract Session" or "Load completed."
- WARN: Flags non-critical issues, like "Null values found in non-mandatory field" or "Rate limit approaching."
- ERROR: Highlights critical failures that demand immediate attention, such as "Transformation failed due to invalid schema" or "Connection timeout" .
Using proper log levels can save time by filtering out irrelevant data - up to 65% less noise to sift through. For example, during an outage, focusing on ERROR-level logs helps pinpoint issues faster. Adding stage-specific logging also improves precision. For instance:
- During extraction, log details like source file names, record counts, and file sizes.
- For transformation, capture data validation errors and memory usage.
- During loading, record target locations and compare successful vs. failed record loads.
Adding Contextual Metadata
Contextual metadata turns logs into powerful diagnostic tools. Each log entry should include:
- Precise timestamps with millisecond accuracy, formatted as
YYYY-MM-DDTHH:MM:SSZ. - Unique identifiers like run IDs, process IDs, and stage-specific details (e.g., source file names or target table names) .
- A traceable ID combining the pipeline name, partition, and execution timestamp (e.g.,
CustomerETL_2026-04-21_143052).
"Capturing metadata is critical, as data pipelines can fail for many reasons. Knowing the exact inputs that caused a failure is essential to implementing a proper fix." - startdataengineering.com
This detailed metadata allows engineers to reproduce failures by understanding the exact conditions at the time of error. Correlation IDs, which track data across pipeline stages, can reduce issue resolution time by over 25%. Additionally, analyzing timestamps for duration metrics can help identify performance bottlenecks - like when an extraction step unexpectedly jumps from 5 seconds to 50 seconds.
Using Standardized Logging Formats
Standardizing log formats ensures consistency and makes logs easier to analyze. JSON is widely used for ETL logging because it’s machine-readable and works seamlessly with tools like the ELK Stack, Splunk, and Datadog . Unlike plaintext logs, which rely on regex parsing, JSON allows for precise filtering by fields like service_name or error_code, speeding up searches .
Each log entry should include a consistent set of fields, such as timestamp, log_level, message, service_name, and process_id . To ensure performance and consistency, use established logging libraries like Log4j (Java/Scala), Winston (Node.js), or structlog (Python). Avoid manual string formatting or print statements, as they can cause bottlenecks in distributed systems like Apache Spark . Enforcing standardized logging practices through cluster policies or configuration templates can prevent deviations.
Error Handling and Notification Strategies
ETL Error Logging Alert Severity Levels and Response Actions
Building on structured logging practices, effective error handling and alerting turn raw data into actionable insights. Catching errors is just the first step - the response determines whether a simple glitch spirals into a major problem. With data teams juggling increasing incident volumes and longer resolution times, having solid error-handling strategies is crucial to keep operations running smoothly.
Real-Time Error Monitoring
Real-time monitoring involves keeping tabs on your ETL pipeline's health as data flows, rather than waiting for someone to notice missing reports. Tools like Prometheus, Grafana, and AWS CloudWatch can track key metrics like data throughput, latency, error rates, and resource usage. Beyond just pipeline status, it's important to monitor data freshness. For instance, check the maximum event timestamp in your target tables - sometimes, a pipeline might report "success" while delivering outdated data that's hours behind schedule.
"ETL pipelines are the plumbing of the data stack. They are invisible when working correctly and catastrophic when they break." - Nawaz Dhandala, OneUptime
Monitor issues at both the row level (null values, type mismatches) and the dataset level (volume drops, completeness issues). Systems with layered validation can catch up to 50% more errors that might otherwise go unnoticed. To avoid false alarms during predictable traffic spikes, use seasonality-aware detectors. This helps prevent alert fatigue and ensures the team focuses on real issues. Real-time insights naturally lead to the need for a tiered alert system that prioritizes errors based on their impact.
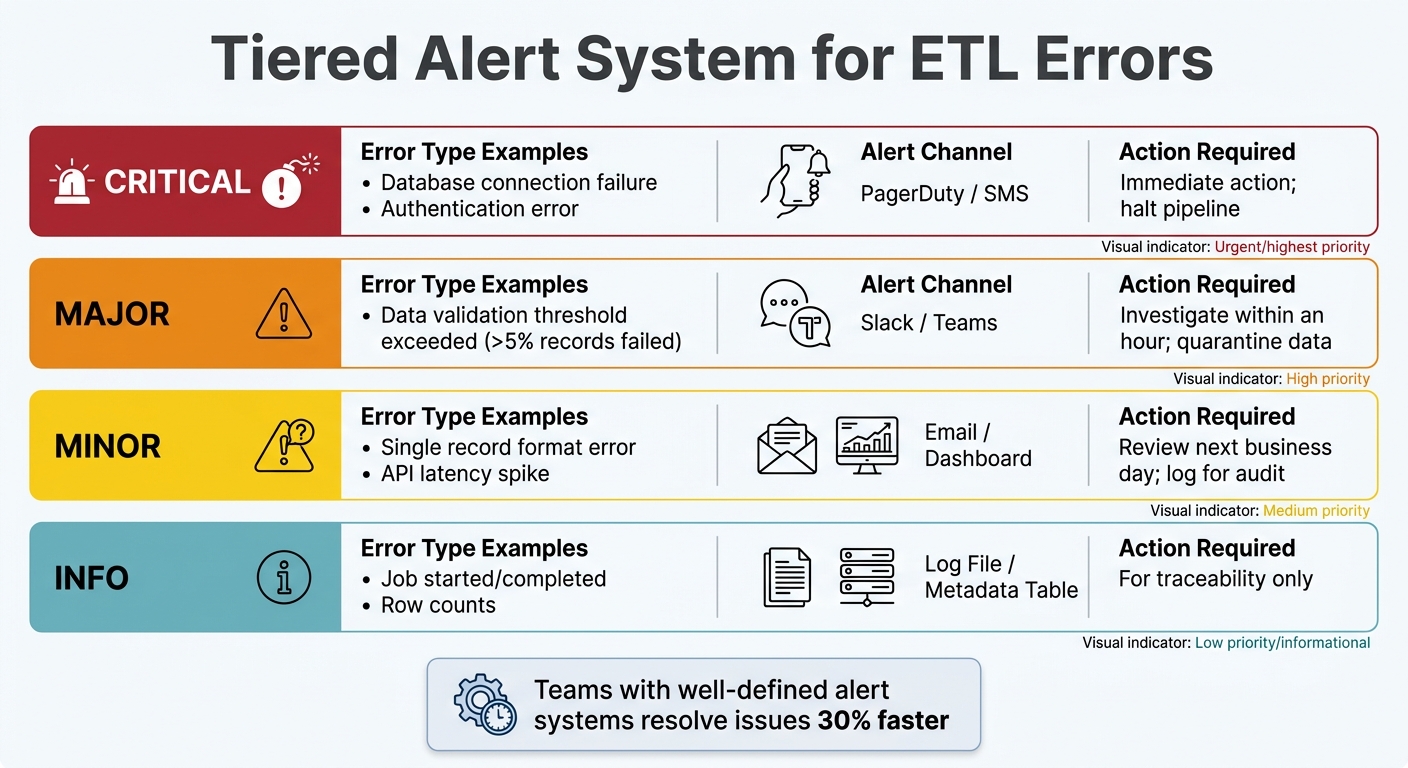
Setting Up Tiered Alert Systems
Not every error justifies a middle-of-the-night wake-up call. A tiered alert system ensures notifications are routed based on severity, so the right people get the right information at the right time. Teams with well-defined alert systems often resolve issues 30% faster.
| Severity Level | Error Type Example | Alert Channel | Action Required |
|---|---|---|---|
| Critical | Database connection failure, authentication error | PagerDuty / SMS | Immediate action; halt pipeline |
| Major | Data validation threshold exceeded (>5% records failed) | Slack / Teams | Investigate within an hour; quarantine data |
| Minor | Single record format error, API latency spike | Email / Dashboard | Review next business day; log for audit |
| Info | Job started/completed, row counts | Log File / Metadata Table | For traceability only |
Set alerts to trigger only when specific KPIs deviate significantly. For example, flag a job that takes 50% longer than usual or fails three times in a row. Use color-coded messages in tools like Slack - red for critical errors, yellow for warnings - to provide quick visual context. Automate escalation so administrators are only notified when thresholds are met, reducing noise from temporary glitches. For transient issues, automated retry logic can step in to handle many errors without human intervention.
Implementing Retry Logic for Temporary Errors
Temporary failures - like network timeouts, API rate limits, or database deadlocks - make up about 60% of errors during high-traffic periods. Retry logic can resolve 80% of these issues without manual intervention. Use exponential backoff for retries, starting with intervals of 1 second, 2 seconds, 4 seconds, and so on.
To avoid overwhelming the system with simultaneous retries (the "thundering herd" effect), add a random jitter of 0–25% to the backoff times. Set a maximum retry count based on the task's priority: 5 attempts for critical transformations, 3–5 for standard jobs, and 1–2 for low-priority tasks. If retries fail, send problematic records to a dead-letter queue (DLQ) for review. This ensures one flawed record doesn’t bring the entire pipeline to a halt.
"The difference between a good ETL pipeline and a great one isn't whether errors happen - it's how gracefully your system handles them." - Sridhar, Platform Engineer
Design pipelines to be idempotent, meaning rerunning the same input won't create duplicates or errors. For example, use partition-based overwrites (DELETE followed by INSERT within a transaction) instead of appending data. Automated remediation strategies can resolve around 70% of routine incidents, freeing up your team to tackle more complex problems. Together, these strategies ensure minor issues stay minor, complementing the real-time monitoring and alerting measures discussed earlier.
Data Isolation and Quarantine Techniques
When errors slip past real-time monitoring and automated retries, isolating problematic records becomes critical. This step ensures that flawed data doesn’t contaminate clean datasets or cause downstream failures. By using staging or quarantine areas for data validation, organizations can significantly reduce load failure rates - by as much as 50% in some cases.
Using Error Tables and Dead-Letter Queues
Dead-letter queues (DLQs) and error tables are essential tools for managing failed records. DLQs are common in messaging and streaming systems like Kafka or AWS SQS, while error tables are often used in platforms like Snowflake to automatically capture rows that fail during ingestion . Both methods retain the original data, along with key metadata, making it easier to diagnose and resolve issues .
"Error logging gives you a SQL-queryable dead-letter queue built into Snowflake. Every row that fails during Snowpipe Streaming ingestion is automatically captured so you can see what failed, why it failed and take steps to fix it." – Andrey Zagrebin, Staff Software Engineer, Snowflake
Modern systems, such as Snowpipe Streaming, can automatically redirect failed rows to error tables. This ensures that valid data continues to load without interruptions . For Snowflake users, enabling error tables is as simple as setting ERROR_LOGGING = TRUE on target tables.
To maintain efficiency, aim to keep DLQ ingestion rates below 1% of total throughput. It’s also a good idea to monitor DLQ backlogs and configure alerts for thresholds - such as when the backlog exceeds 1,000 messages or when the ingestion rate spikes unexpectedly . Automating fixes is another smart move. For example, creating streams on error tables can trigger tasks to resolve common issues (like type mismatches) and reprocess the corrected data. Once errors are captured, quarantine zones provide the environment to validate and reintegrate the data systematically.
Setting Up Quarantine Areas for Data Validation
Quarantine zones work hand-in-hand with error tables, offering a controlled space to analyze and correct invalid records before they re-enter the data pipeline. These zones isolate flawed data while allowing valid records to flow into target systems . To aid debugging and reprocessing, always store the original, unaltered payload as it was received .
Errors can be categorized as either "Transient" (e.g., network timeouts) for automated retries or "Permanent" (e.g., schema violations) that require manual intervention . Using SQL-queryable storage for quarantine zones allows data teams to identify failure patterns with standard SQL queries .
Design pipelines with a "replay" mechanism to reintroduce corrected data into the main ETL flow once issues are resolved . Keep an eye on how long records remain in quarantine - critical streams should aim for review times under 24 hours. Additionally, set a Time to Live (TTL) for quarantined data to manage storage costs and meet compliance requirements.
Monitoring and Resolving Issues
After identifying problematic data, the next step is ensuring those issues don’t resurface. This requires continuous monitoring to catch problems early and address their root causes effectively.
Detecting Anomalies in ETL Workflows
The key to spotting anomalies lies in smart threshold settings. Use historical performance data to set alerts: trigger warnings at 80% and critical alerts at 95% of normal operation. This approach minimizes false alarms while flagging real problems before they escalate.
Focus on four key metrics for monitoring:
- Pipeline execution: Keep an eye on success and failure rates.
- Data quality: Track row counts and data freshness.
- Performance: Monitor job durations and throughput.
- Resource utilization: Watch CPU and memory usage.
For example, a job that usually takes 20 seconds but suddenly jumps to 60 seconds, or CPU usage exceeding 85%, signals potential bottlenecks.
Another frequent issue is schema drift, which accounts for over 44% of data pipeline disruptions. Schema drift happens when column names, data types, or table structures change unexpectedly. Automated validation tools like Great Expectations or Deequ can help by creating delta reports and triggering alerts when changes occur.
Once anomalies are detected, the next step is to dig deeper and prevent them from happening again.
Performing Root Cause Analysis of Recurring Errors
Recurring errors are a major challenge - about 75% of data processing issues stem from unresolved problems. Breaking this cycle requires a deeper examination of the underlying causes. The "5 Whys" method, which involves repeatedly asking "why" to uncover the root cause, has been shown to cut recurrence rates by nearly 50%.
Using Correlation IDs can also speed up the process. These IDs trace data through every stage of the pipeline, making it easier to pinpoint where things went wrong.
"Organizations that prioritize log analysis improve their operational efficiency by 20-30%." – Gartner
After any major failure, conduct a formal post-mortem analysis. This involves documenting what happened, why it happened, and what changes can prevent it from happening again. Updating remediation playbooks and training protocols based on this analysis can significantly improve response times. In fact, organizations with well-structured alert systems resolve issues 30% faster.
Tracking and Improving Data Quality
Once anomalies and root causes are addressed, ongoing quality tracking ensures your ETL processes stay on track. Data quality monitoring should happen at multiple levels:
- Row-level validation: Check for issues like null values, incorrect formats, and field length violations.
- Dataset-level validation: Ensure total row counts and data volume remain consistent.
Set performance thresholds to trigger alerts when error rates exceed 1% per batch or when tasks require more than two retries. Data freshness is another critical factor - if your data is more than two hours behind, something likely needs attention. Row counts between source and target systems should align, with a variance of less than 0.5% per batch. For essential fields like timestamps and identifiers, aim to keep null values below 0.1%.
Layered validation at both the source and destination can cut undetected errors by half. This is crucial, as nearly 27% of data jobs fail due to missing or incorrect fields. With data teams reporting an average of 67 incidents per month in 2026 - up from 59 the previous year - proactive quality monitoring is more important than ever. By turning error logging into a proactive tool, organizations can shift from merely reacting to problems to strategically managing data quality.
Conclusion
ETL error logging isn’t just about tracking failures - it’s about creating a dependable data infrastructure that keeps your business operations steady. Considering that poor data quality costs organizations an average of $12.9 million annually and affects 89% of critical business decisions, getting this process right is crucial.
The strategies we’ve touched on earlier emphasize structured logging, validation at multiple levels, and automated alerts. These aren’t just technical recommendations - they’re practical steps that improve error management and enhance operational efficiency.
Start with the basics: adopt standardized formats like JSON for your logs, use dead-letter queues to isolate problem records, and implement retry mechanisms with exponential backoff. These methods alone can cut load failures by up to 40% and recover 80% of temporary issues. Additionally, ensure idempotency to prevent duplicate data during reprocessing. These foundational practices strengthen your data pipeline, equipping it to handle everything from minor issues to major disruptions.
Real-time monitoring plays a key role, reducing incident resolution times by 60% to 70%, while automated data quality checks can prevent 60% of data-related failures. By integrating these best practices into your ETL process, you move beyond simply reacting to errors. Instead, you build a proactive system that supports accurate decision-making and empowers your team to deliver reliable, timely insights.
FAQs
What should every ETL error log entry include?
Every ETL error log entry needs to include critical details to make troubleshooting easier and protect data accuracy. Key elements to capture are:
- Error type: Clearly specify the nature of the error (e.g., missing data, transformation failure).
- Severity: Indicate how serious the error is and whether it requires immediate attention.
- Impact: Outline the effect of the error on the ETL process or downstream systems.
- Timestamp: Record the exact date and time the error occurred for precise tracking.
- Contextual information: Provide any additional details, such as affected data rows or process IDs, to aid in diagnosis.
These components ensure errors are resolved quickly and the overall process remains dependable.
How do I set alert thresholds without alert fatigue?
To keep alert fatigue at bay, concentrate on critical issues by setting clear thresholds that highlight genuine problems instead of minor changes. Implement tiered alerts - for example, use warnings for less urgent matters and reserve immediate alerts for serious errors. Make it a habit to review and fine-tune these thresholds using historical data. This approach helps ensure your alerts remain meaningful and actionable, striking a balance between effective monitoring and avoiding notification overload.
When should I use a dead-letter queue vs an error table?
A dead-letter queue (DLQ) is a holding area for unprocessed messages or data that couldn't be handled after several retry attempts. It helps isolate problematic items, allowing for manual inspection or reprocessing without disrupting the entire system. On the other hand, an error table is a database tool that logs detailed error information - such as validation or transformation issues - making it easier to query and debug specific problems. DLQs are ideal for message-based systems to keep processes running smoothly, while error tables are better suited for structured error tracking in relational databases.